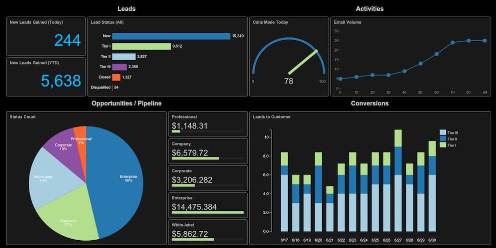
BI tools

Visual Analytics

Visual Analytics – A Layman’s Approach

What is Visual Analytics? Visual Analytics is an area that applies analysis and reasoning to information sets using some sort of visual means. It combines the best of a person’s capabilities (decision making, analysis, and reasoning) with the number crunching capabilities of a computer. Visual analytics is a form of inquiry in which data that

Visual Analytics – A Layman’s Approach Read More »

Business Intelligence

Business Intelligence Tools and Trends

Business Intelligence (BI) refers to applications, technologies and practices or the collection, integration, analysis, and presentation of business information. The purpose of Business Intelligence is to support better business decision making. Essentially, Business Intelligence systems are data driven Decision Support Systems (DSS). Importance of Business Intelligence tools or software solutions Business Intelligence systems provide historical,

Business Intelligence Tools and Trends Read More »

Data Visualization Trends

Data Visualization and Current Trends

Data visualization is the techniques to communicate data or information by encoding it as visual objects. We may call it visual communication. Data Visualization is actually the use of computer graphics to create visual images which aid in the understanding of complex, often massive representations of data. To communicate information clearly and efficiently, data visualization

Data Visualization and Current Trends Read More »

Market Intelligence – An Overview

What is Market Intelligence MI or Market Intelligence System is actually a business analytics tool that analyses business data obtained from various sources like Customers, Competitors, supply chain, stores etc. It helps organizations in making decisions and formulating future strategies regarding, target market, product development, promotional campaigns, consumer perception etc. only if apt, relevant and

Market Intelligence – An Overview Read More »

Scroll to Top